In 2023 we saw 289 youth for a total of 4090 visits.
Below are tables with attendance summaries for the Visitors and Visits for all of 2023.
| January | February | March | April | May | June | July | August | September | October | November | December | |
| visits | 310 | 250 | 373 | 351 | 451 | 346 | 88 | 109 | 537 | 649 | 401 | 333 |
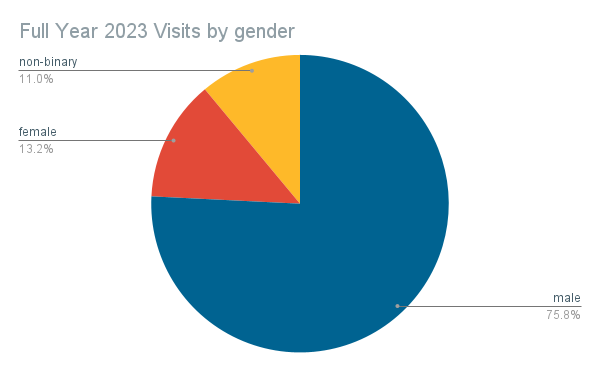
| Male | 225 | 187 | 295 | 297 | 365 | 272 | 66 | 95 | 414 | 481 | 271 | 218 |
| Female | 48 | 29 | 31 | 21 | 35 | 27 | 11 | 10 | 75 | 103 | 85 | 69 |
| Non-binary | 37 | 34 | 46 | 32 | 51 | 47 | 11 | 4 | 48 | 63 | 43 | 46 |
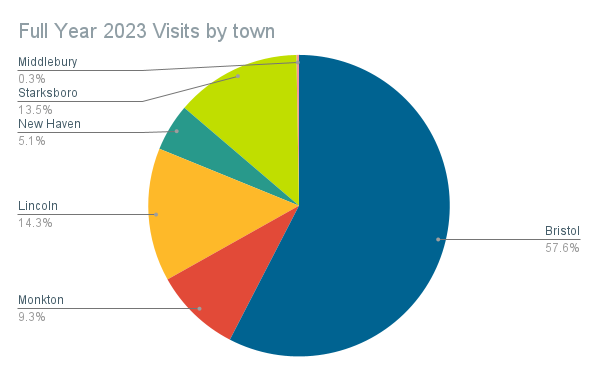
| Bristol | 164 | 149 | 209 | 187 | 256 | 201 | 68 | 92 | 329 | 372 | 209 | 165 |
| Monkton | 27 | 22 | 48 | 60 | 47 | 26 | 0 | 0 | 50 | 48 | 26 | 27 |
| New Haven | 18 | 9 | 15 | 19 | 19 | 19 | 0 | 1 | 28 | 45 | 19 | 15 |
| Lincoln | 39 | 28 | 44 | 30 | 59 | 41 | 8 | 11 | 67 | 105 | 91 | 71 |
| Starksboro | 61 | 39 | 55 | 55 | 70 | 57 | 10 | 4 | 58 | 68 | 40 | 46 |
| Visitors | ||||||||||||
| Visitors | 92 | 95 | 105 | 102 | 117 | 108 | 25 | 44 | 120 | 135 | 93 | 99 |
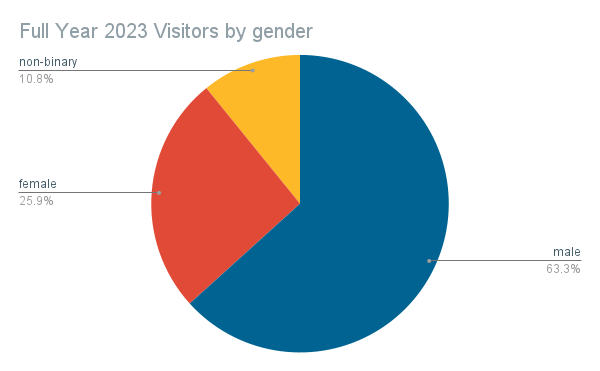
| Male | 60 | 65 | 77 | 79 | 86 | 79 | 17 | 36 | 80 | 91 | 65 | 63 |
| Female | 17 | 14 | 14 | 8 | 17 | 15 | 4 | 5 | 28 | 28 | 20 | 23 |
| Non-binary | 15 | 16 | 13 | 14 | 14 | 14 | 4 | 3 | 12 | 14 | 7 | 13 |
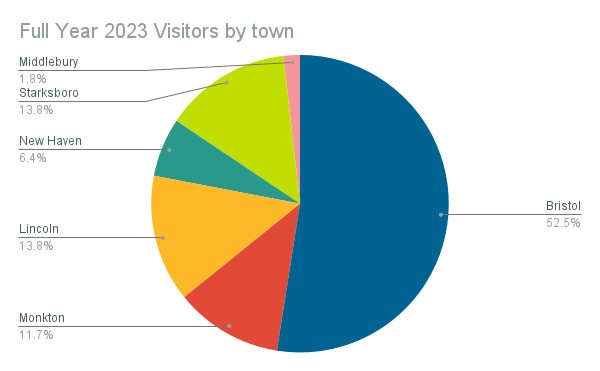
| Bristol | 45 | 53 | 55 | 53 | 64 | 53 | 18 | 34 | 64 | 68 | 50 | 52 |
| Monkton | 10 | 11 | 13 | 14 | 18 | 14 | 0 | 0 | 15 | 17 | 11 | 10 |
| New Haven | 9 | 6 | 6 | 8 | 7 | 6 | 0 | 1 | 8 | 8 | 6 | 5 |
| Lincoln | 12 | 10 | 14 | 11 | 13 | 17 | 3 | 7 | 15 | 18 | 14 | 18 |
| Starksboro | 15 | 0 | 16 | 16 | 15 | 17 | 2 | 1 | 15 | 17 | 9 | 12 |