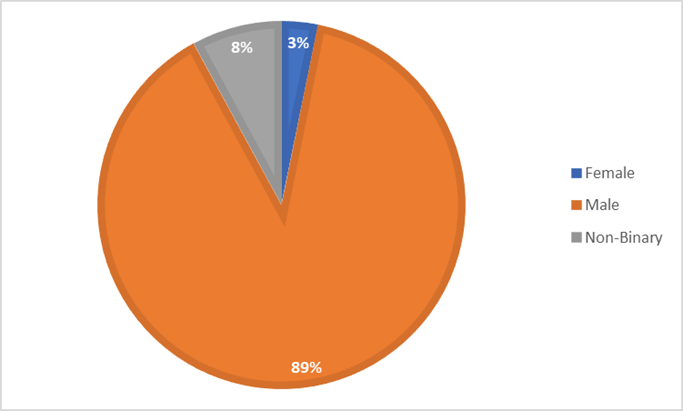
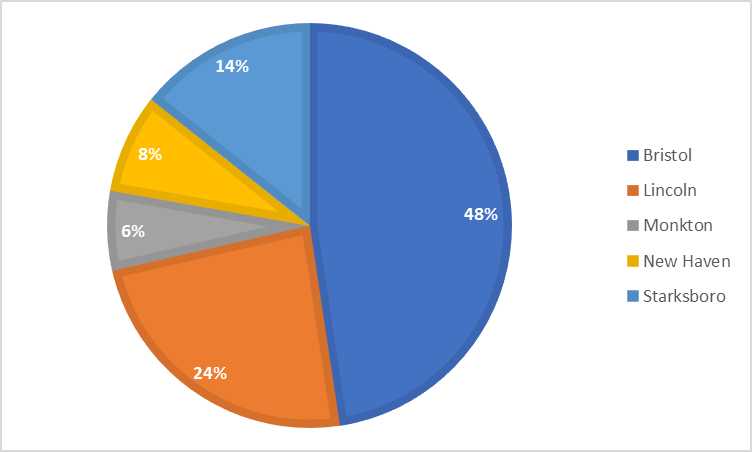
Week 1: The Hub had 35 individual youth generate a total of 68 logins over the course of five days. An average of about 14 logins per day.
Here’s how those numbers break down by gender and town served.

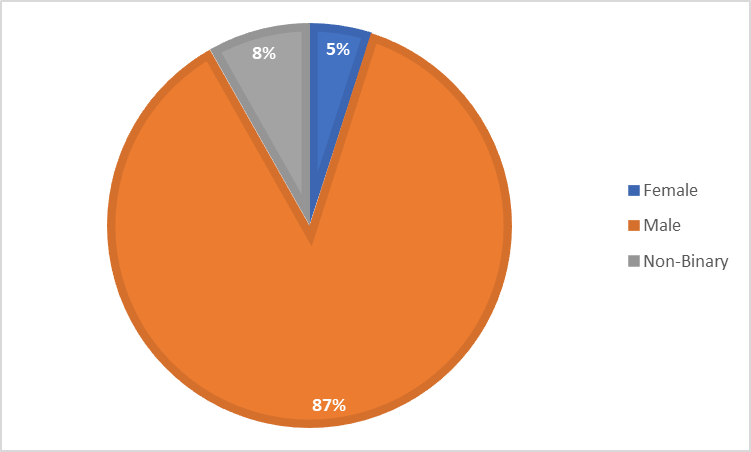
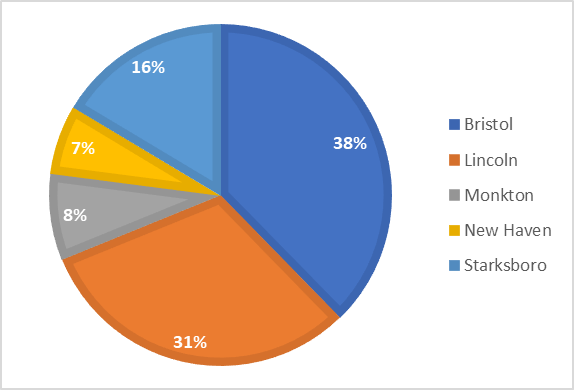
Week 2: The Hub had 35 individual youth generate a total of 64 logins over the course of five days. An average of about 13 logins per day.
Here’s how those numbers break down by gender and town served.

Week 3: The Hub had 48 individual youth generate a total of 62 logins over the course of five days. An average of about 12 logins per day.
Here’s how those numbers break down by gender and town served.
Week 4: Hub closed for Spring Break. The Hub staff spent the week re-organizing and painting the interior of the Hub as well as repairing and re-painting one of the larger skatepark features in preparation for the BMX Show/ Human Powered Parade coming up on May 11th.