The Hub had a total of 288 logins during January 2020. Due to school breaks, the Hub was open for 20 days.
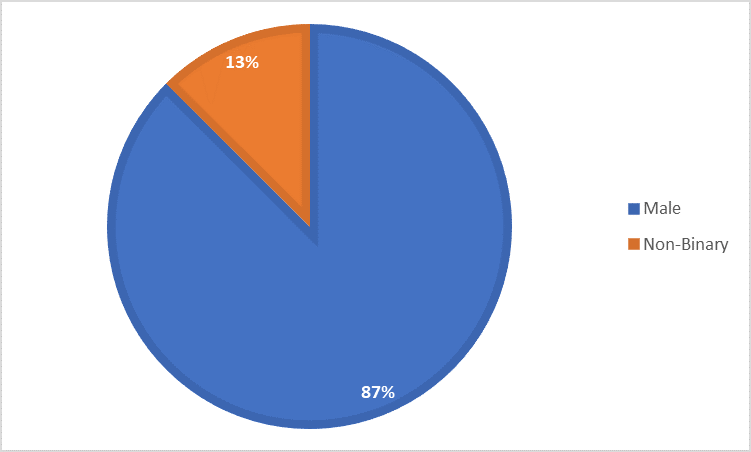
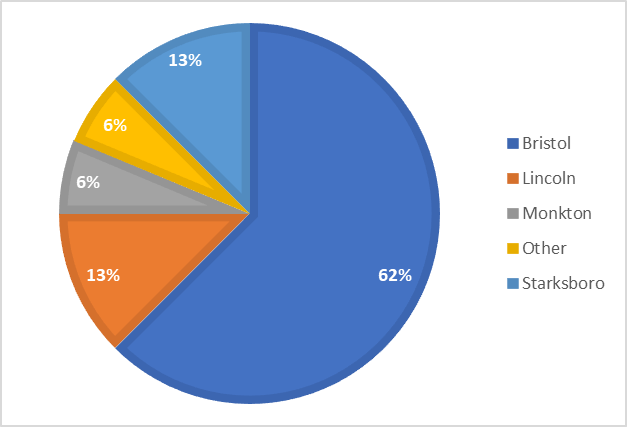
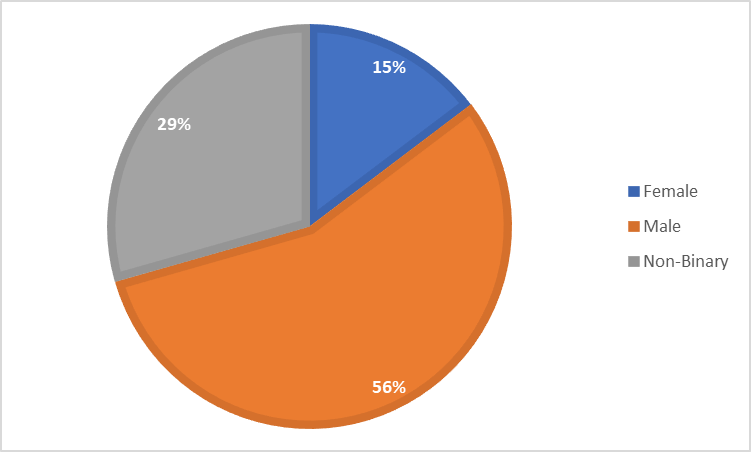
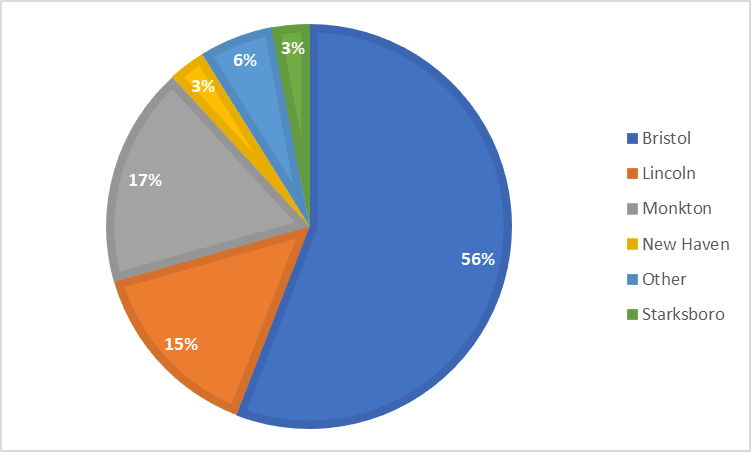
Week 1: The Hub had 17 individual youth generate a total of 24 logins over the course of two days. An average of about 12 logins per day.
Here’s how those numbers break down by gender and town served.
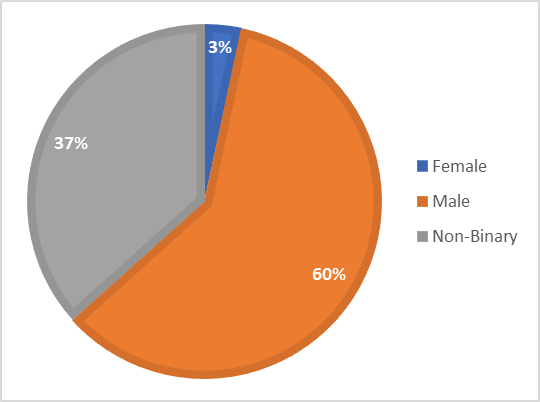
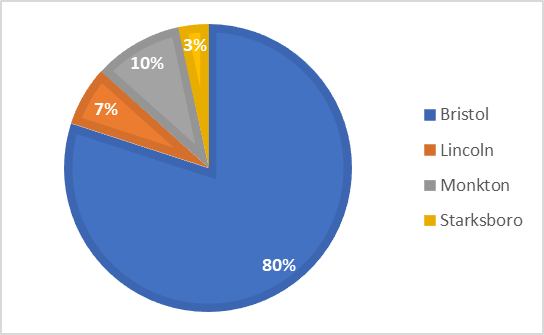
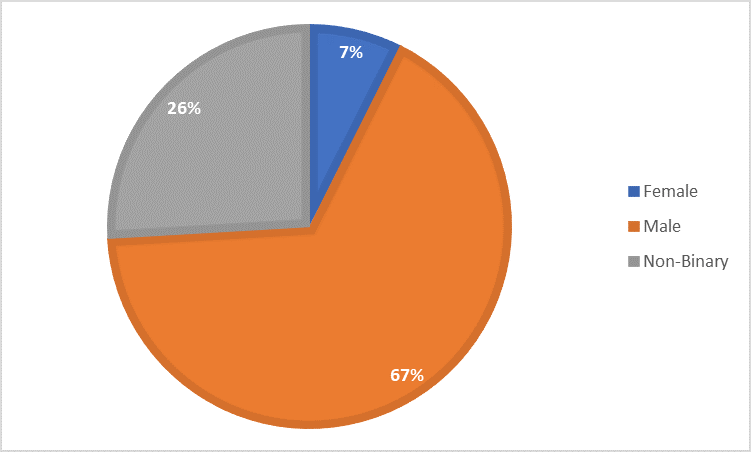
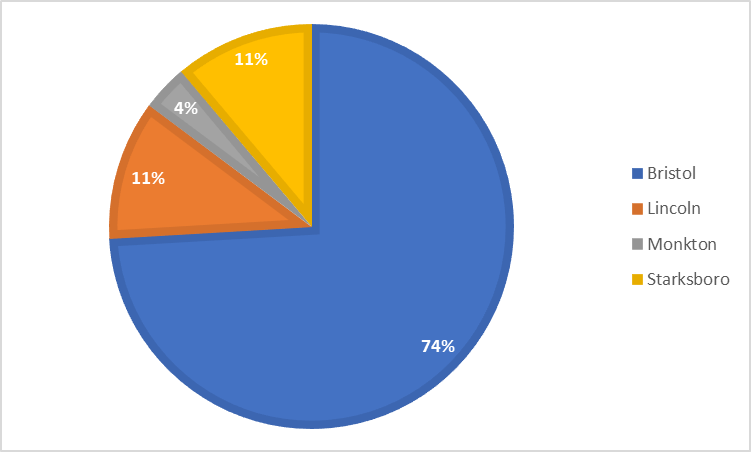
Week 2: The Hub had 29 individual youth generate a total of 63 logins over the course of five days. An average of about 12 logins per day.


Week 3: The Hub had 39 individual youth generate a total of 69 logins over the course of five days. An average of about 14 logins per day.
Week 4: The Hub had 32 individual youth generate a total of 49 logins over the course of three days. An average of about 16 logins per day.
Week 5: The Hub had 43 individual youth generate a total of 83 logins over the course of five days. An average of about 16 logins per day.