The Hub had a total of 156 logins during July 2019, our highest total for the month of July in 5 years!
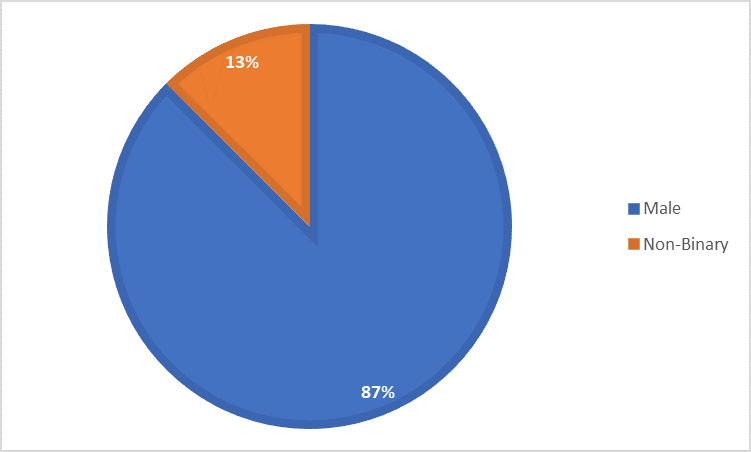
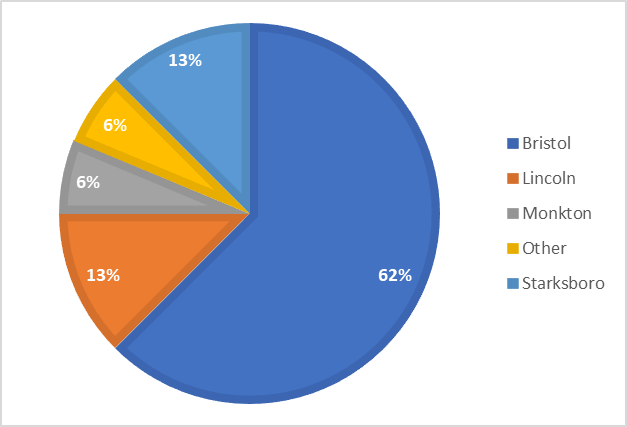
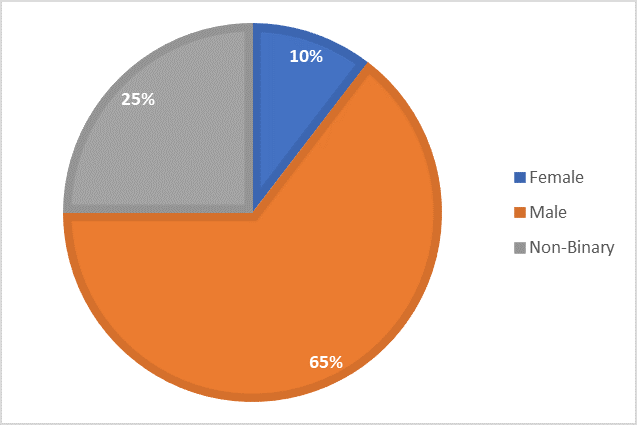
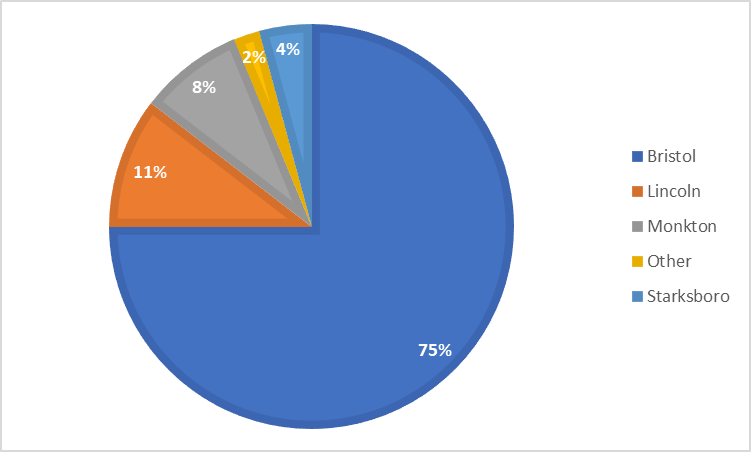
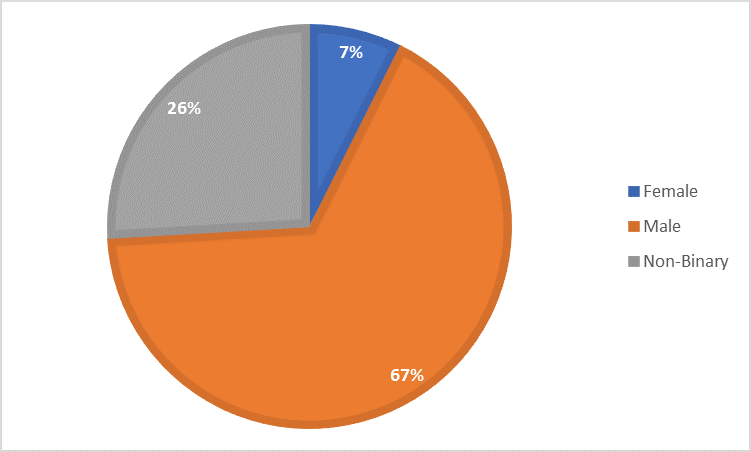
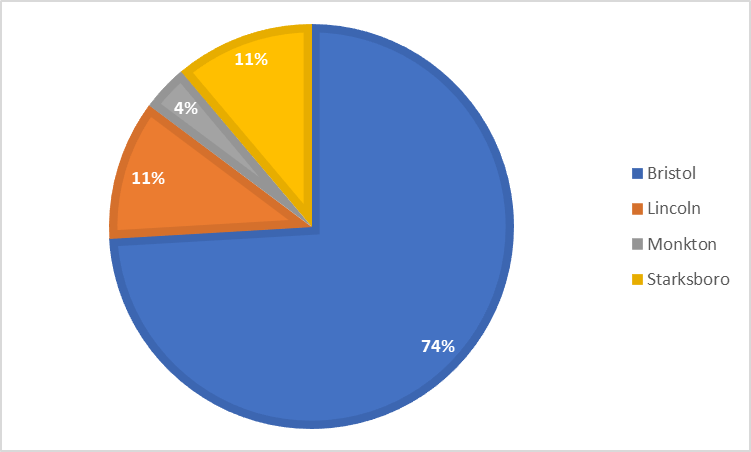
Week 1: The Hub had 20 individual youth generate a total of 31 logins over the course of three days. An average of about 10 logins per day.
Here’s how those numbers break down by gender and town served.
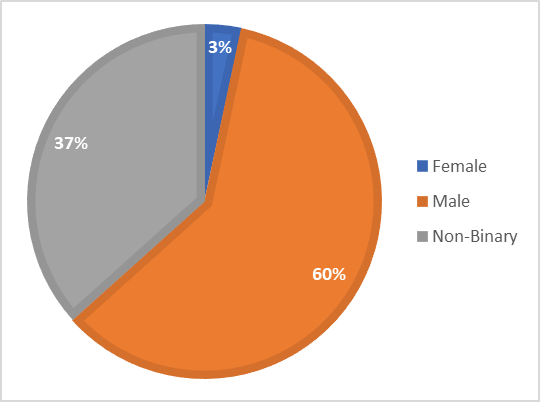
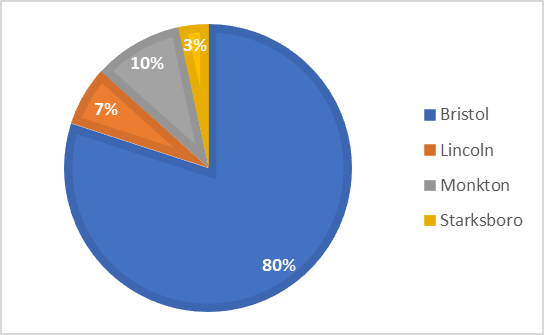
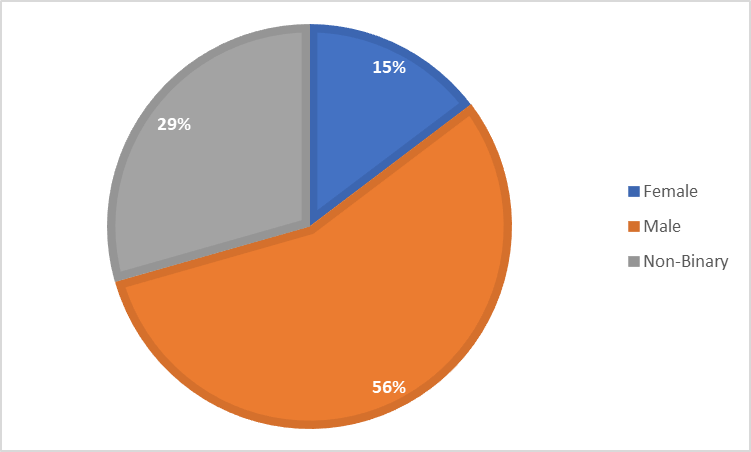
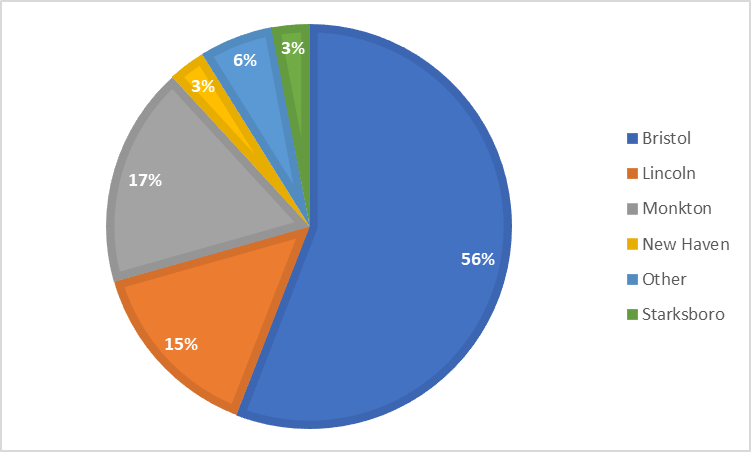
Week 2: The Hub had 23 individual youth generate a total of 49 logins over the course of five days. An average of about 10 logins per day.
Here’s how those numbers break down by gender and town served.
Week 3: The Hub had individual 20 youth generate a total of 35 logins over the course of five days. An average of about 7 logins per day.
Here’s how those numbers break down by gender and town served.
Week 4: The Hub had 15 individual youth generate a total of 28 logins over the course of five days. An average of about 5 logins per day.
Here’s how those numbers break down by gender and town served.
Week 5: The Hub had individual 12 youth generate a total of 17 logins over the course of four days. An average of about 4 logins per day.
Here’s how those numbers break down by gender and town served.