The Hub had a total of 309 logins during October 2019.
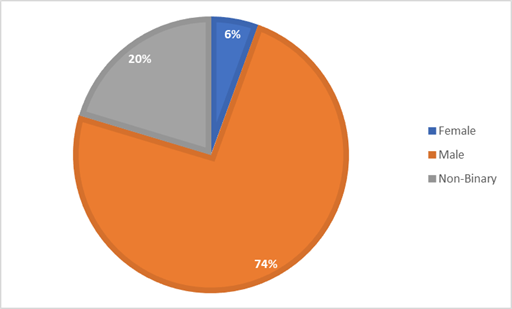
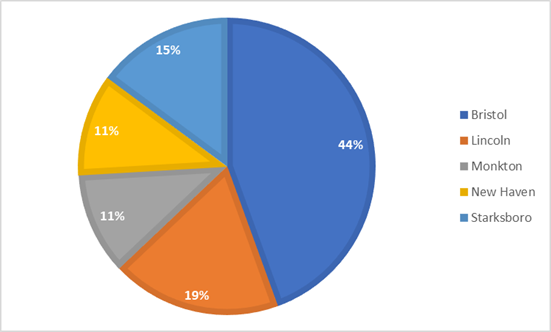
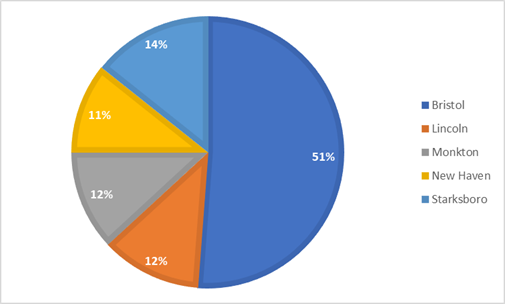
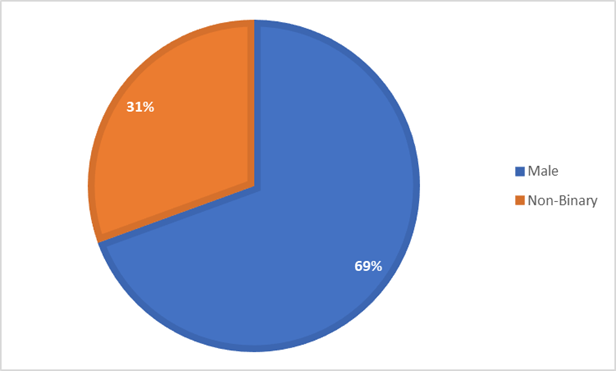
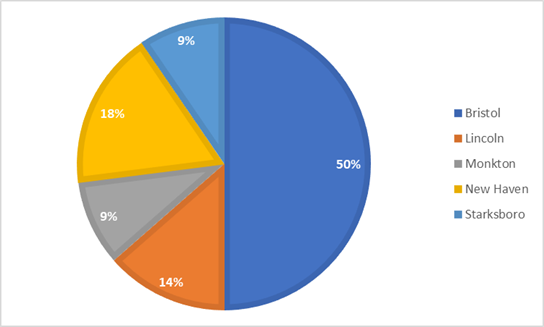
Week 1: The Hub had 21 individual youth generate a total of 56 logins over the course of four days. An average of about 14 logins per day.
Here’s how those numbers break down by gender and town served.

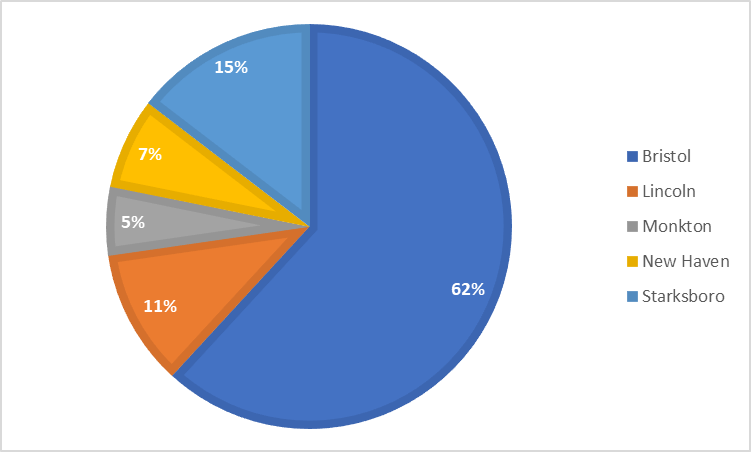
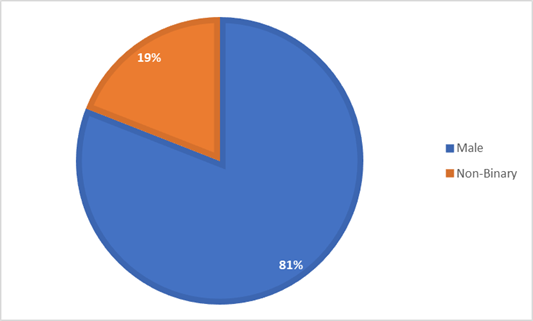
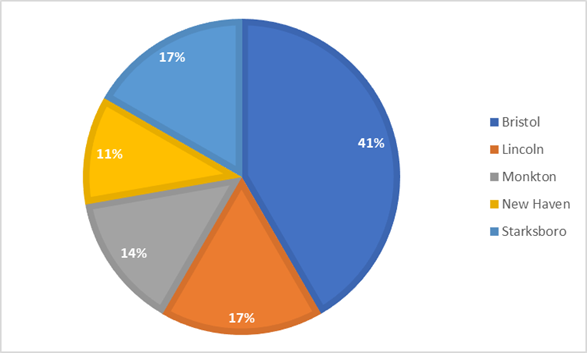
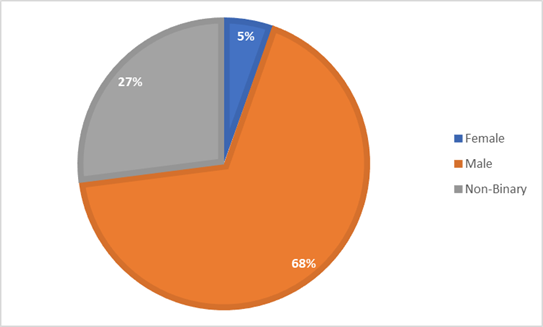
Week 2: The Hub had 21 individual youth generate a total of 85 logins over the course of five days. An average of about 17 logins per day.
Here’s how those numbers break down by gender and town served.
Week 3: The Hub had 24 individual youth generate a total of 37 logins over the course of four days. An average of about 9 logins per day.
Here’s how those numbers break down by gender and town served.
Week 4: The Hub had 34 individual youth generate a total of 75 logins over the course of five days. An average of about 15 logins per day.
Here’s how those numbers break down by gender and town served.
Week 5: The Hub had 34 individual youth generate a total of 55 logins over the course of four days. An average of about 14 logins per day.
Here’s how those numbers break down by gender and town served.