The Hub had a total of 232 logins during September 2019.
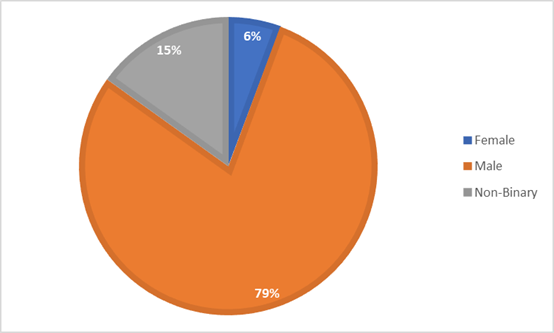
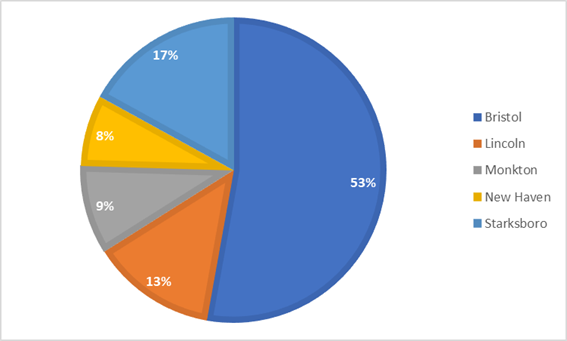
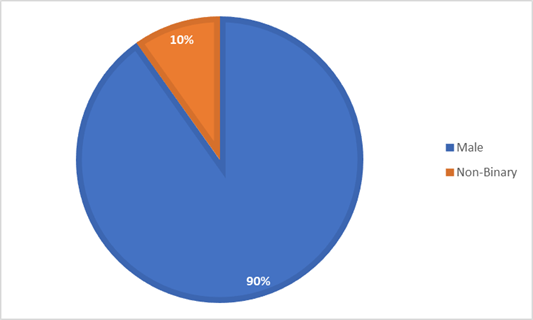
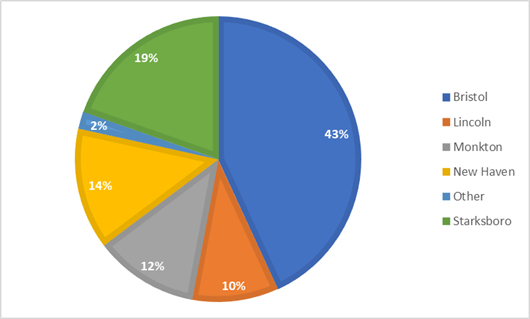
Week 1: The Hub had 21 individual youth generate a total of 52 logins over the course of four days. Anaverage of about 13 logins per day.
Here’s how those numbers break down by gender and town served.
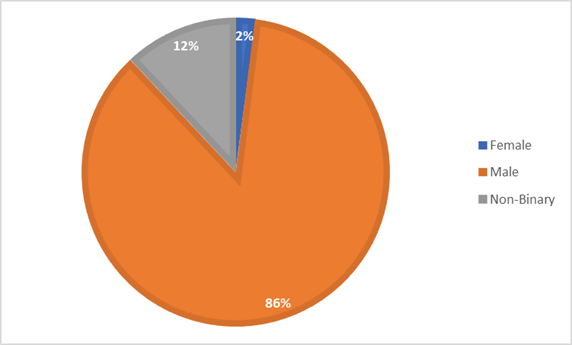
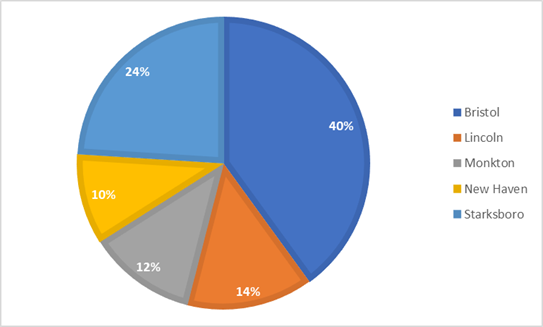
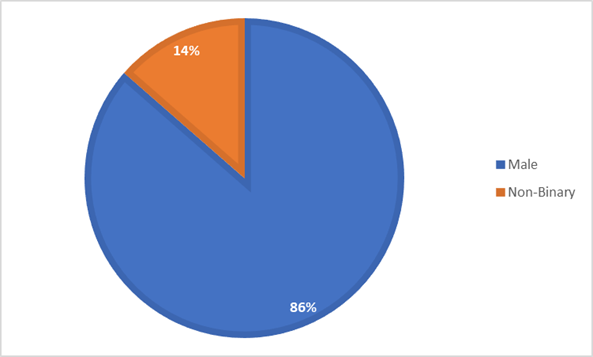
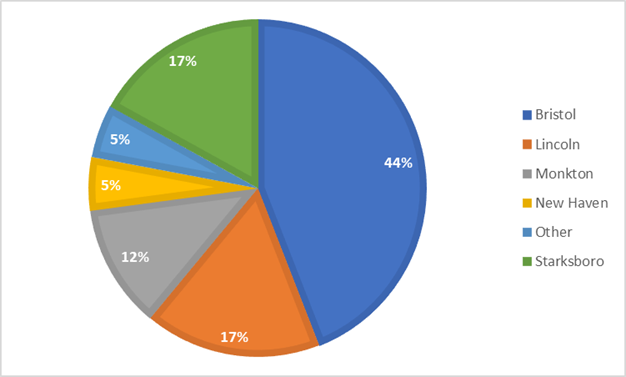
Week 2 : The Hub had 21 individual youth generate a total of 52 logins over the course of five days. An average of about 10 logins per day.
Here’s how those numbers break down by gender and town served.
Week 3: The Hub had 32 individual youth generate a total of 60 logins over the course of fivedays. An average of about 12 logins per day.
Here’s how those numbers break down by gender and town served.
Week 4: The Hub had 32 individual youth generate a total of 54 logins over the course of fivedays. An average of about 11 logins per day.
Here’s how those numbers break down by gender and town served.