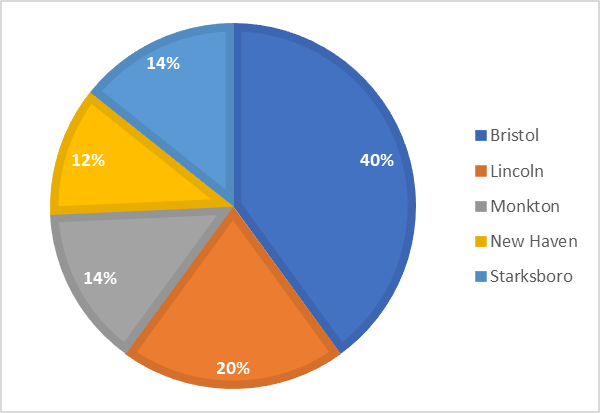
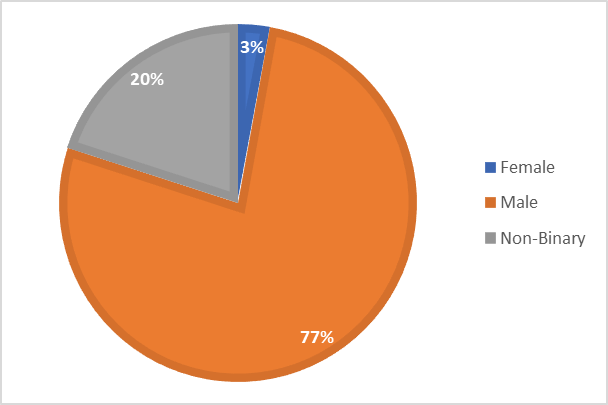
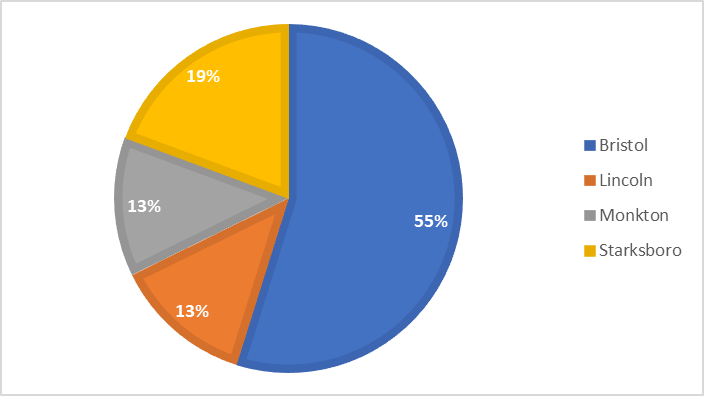
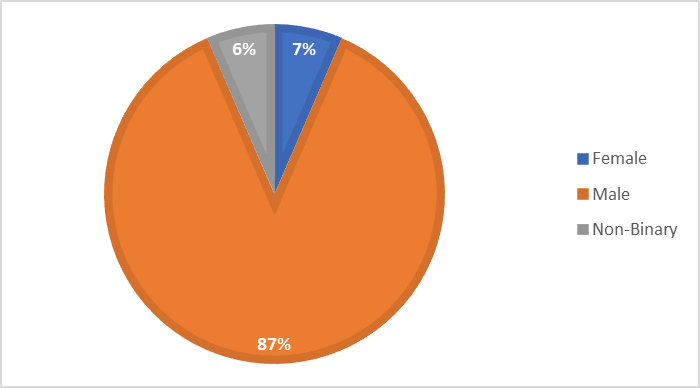
Week 1: The Hub had 29 individual youth generate a total of 59 logins over the course of five days. An average of about 12 logins per day.
Here’s how those numbers break down by town and gender served.
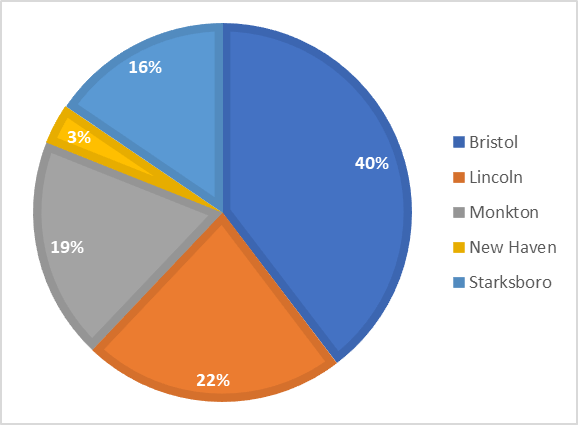
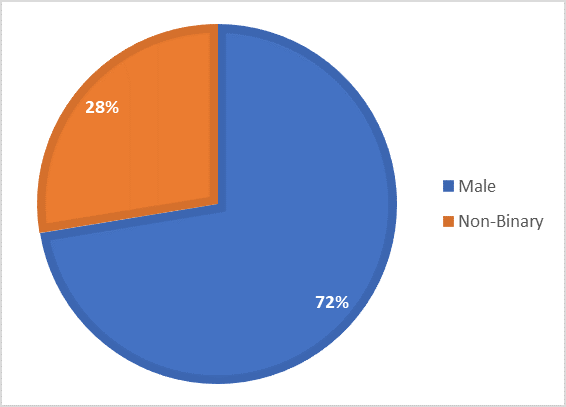
Week 2: The Hub was closed two days due to school cancellations. The Hub had 17 individual youth generate a total of 32 logins over the course of three days. An average of about 11 logins per day.
Here’s how those numbers break down by town and gender served.
Week 3: The Hub was closed for Winter Break
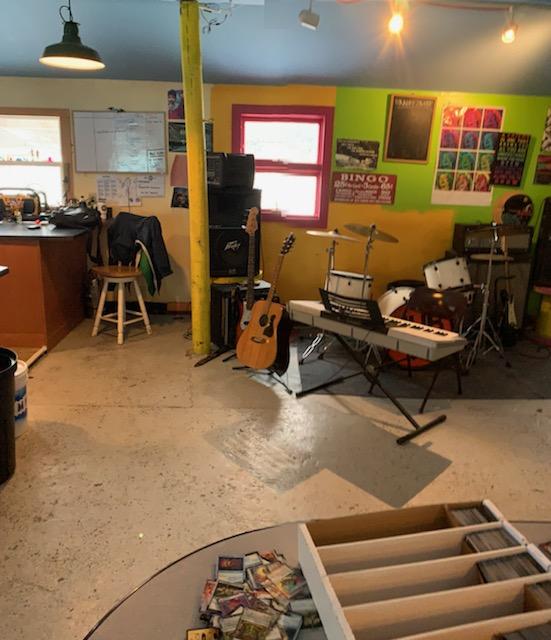
The Hub staff and some teen volunteers spent the better part of two days sprucing up the Hub with new paint and a bit of furniture moving!
Week 4: The Hub had 20 individual youth generate a total of 36 logins over the course of five days. An average of about 7 logins per day.