Week 1 Report
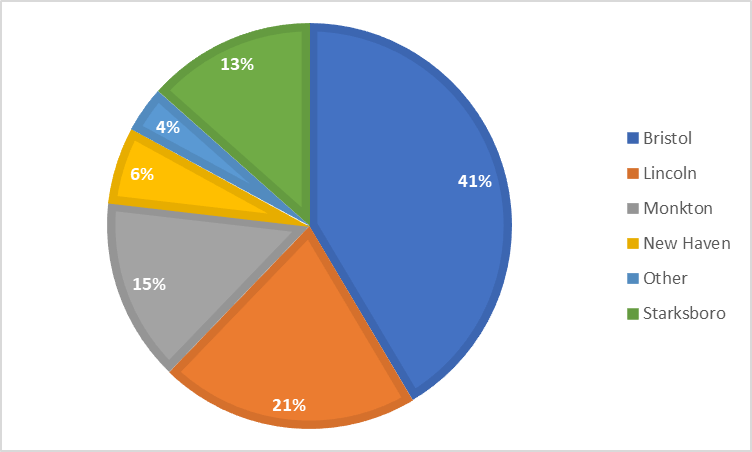
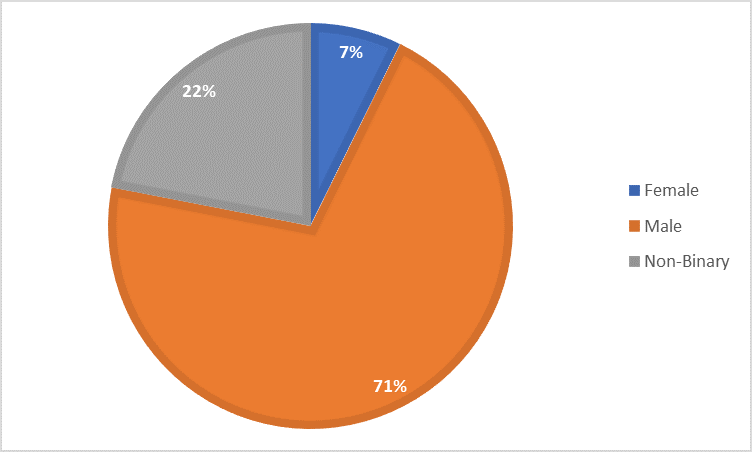
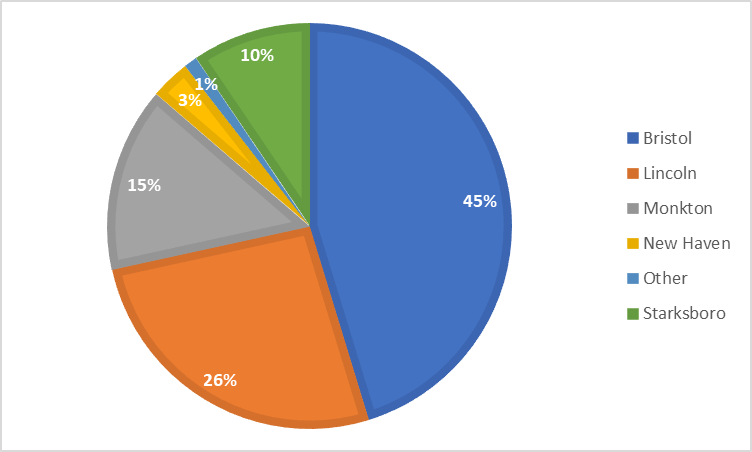
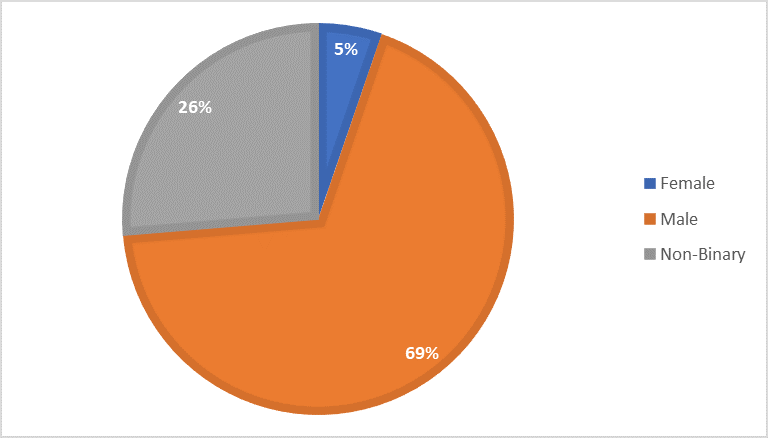
The Hub had 43 individual youth generate a total of 83 logins over the course of five days. An average of about 17 logins per day.
Here’s how those numbers break down by town and gender served.
Week 2 Report
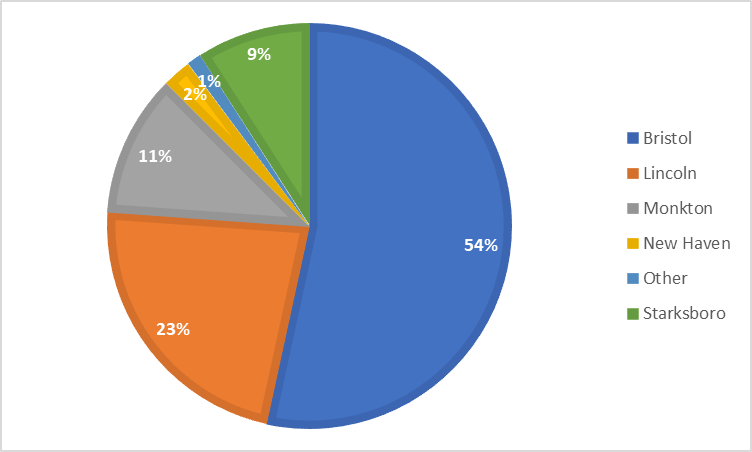
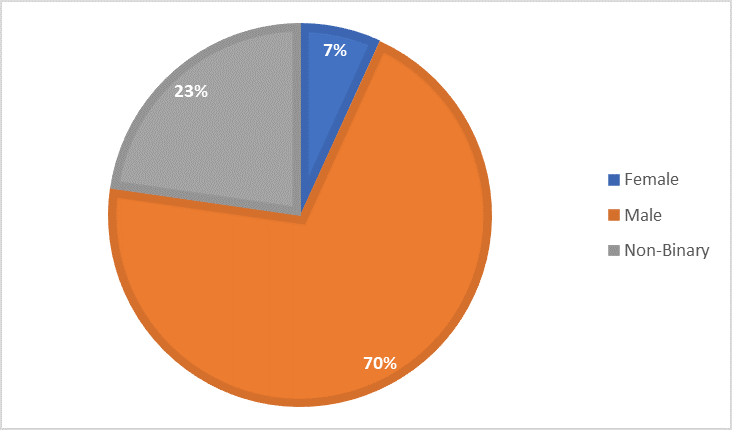
The Hub had 42 individual youth generate a total of 89 logins over the course of five days. An average of about 18 logins per day.
Here’s how those numbers break down by town and gender served.
Week 3 Report
The Hub had 43 individual youth generate a total of 96 logins over the course of five days. An average of about 19 logins per day.
Here’s how those numbers break down by town and gender served.
Week 4 Report
HUB CLOSED FOR WINTER BREAK