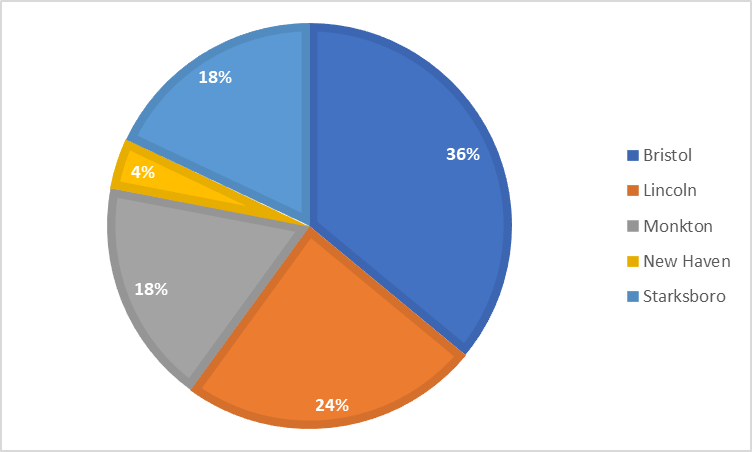
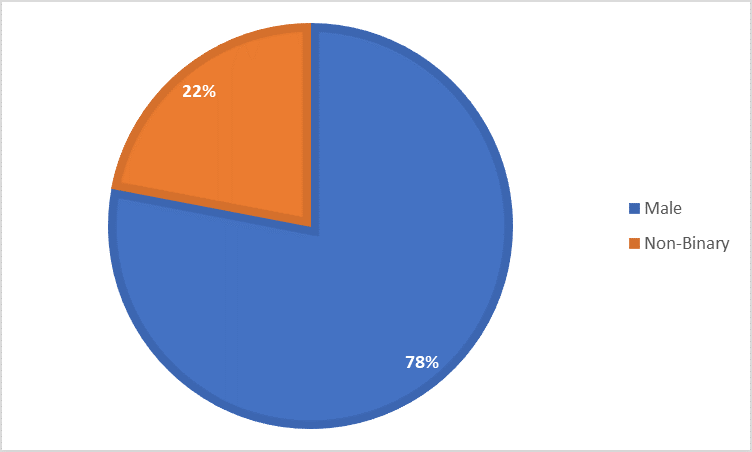
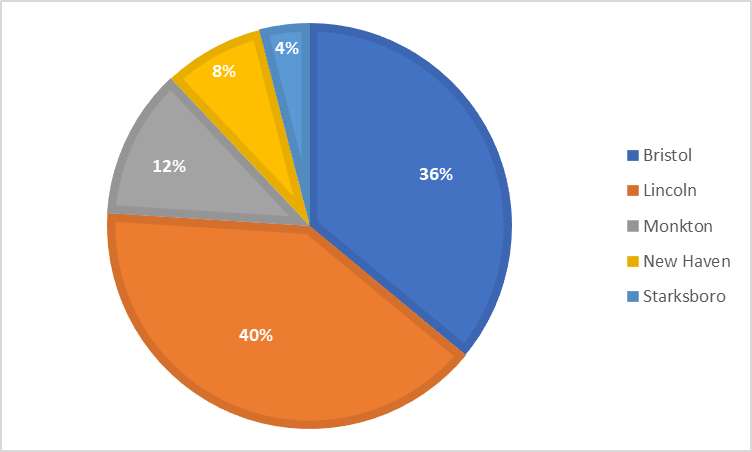
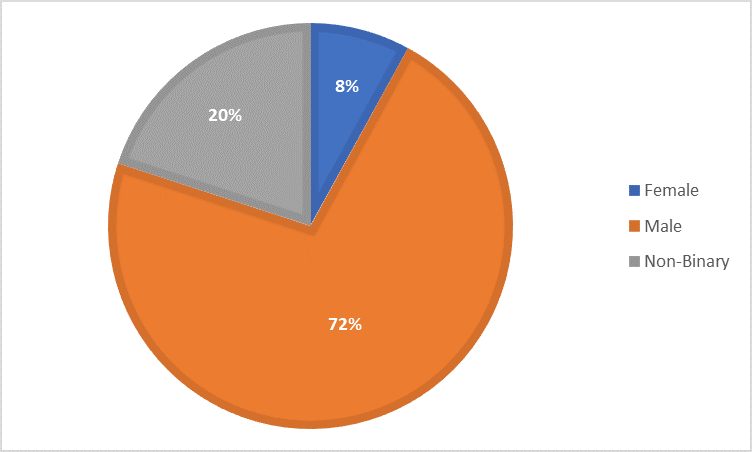
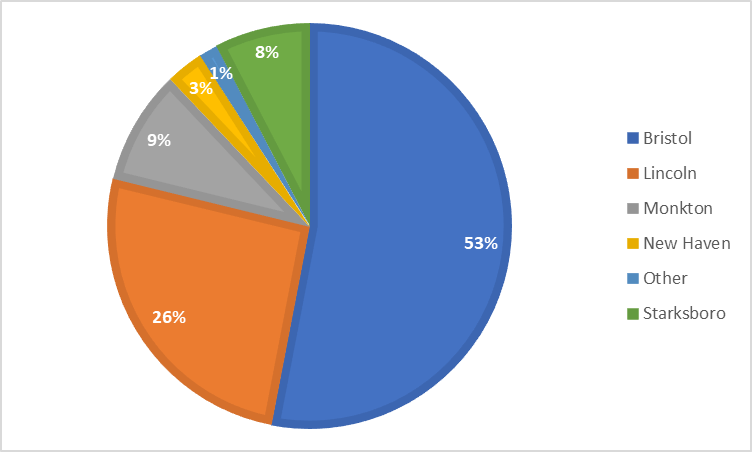
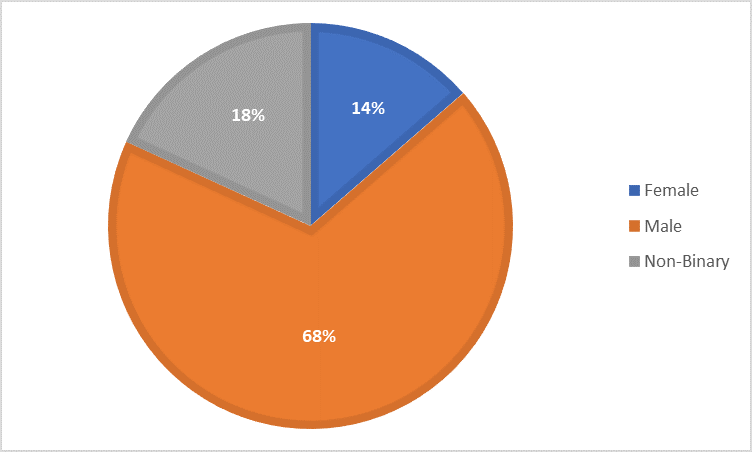
Week 1: The Hub had 29 individual youth generate a total of 43 logins over the course of three days. An average of about 14 logins per day.
Here’s how those numbers break down by town and gender served.
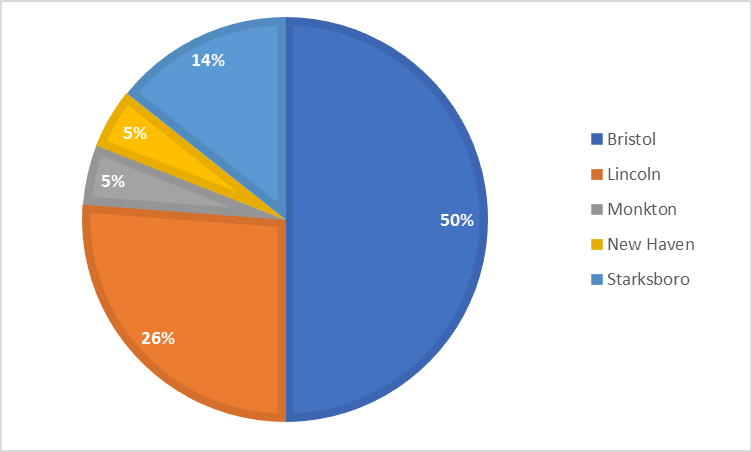
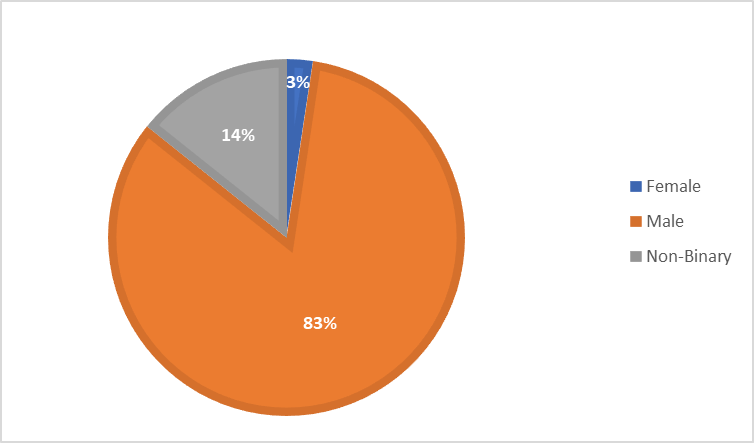
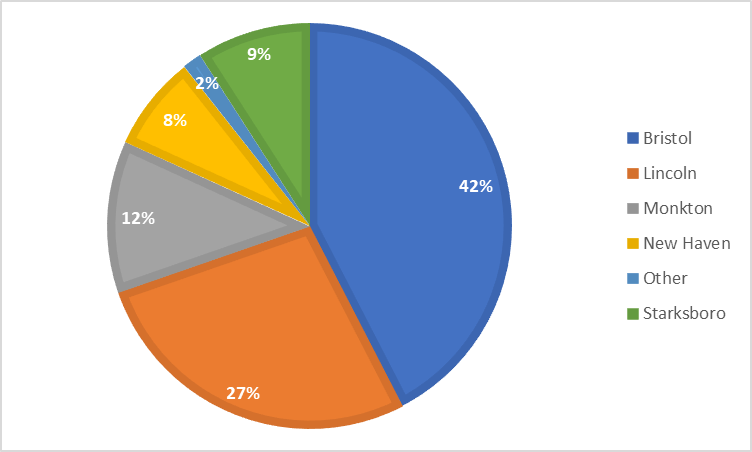
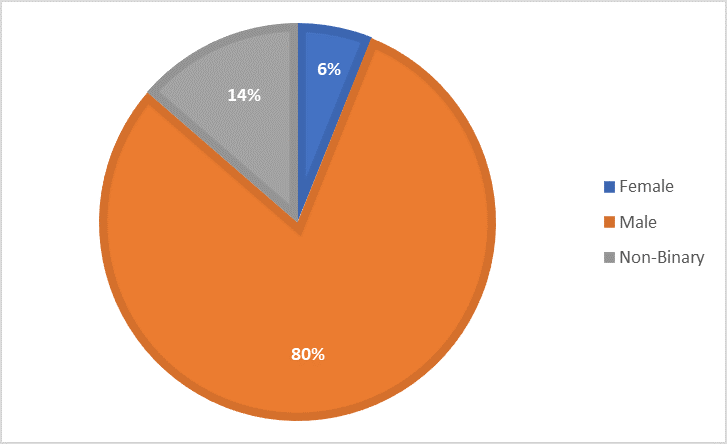
Week 2: The Hub had 29 individual youth generate a total of 54 logins over the course of four days. An average of about 13.5 logins per day.
Here’s how those numbers break down by town and gender served.
Week 3: The Hub had 32 individual youth generate a total of 66 logins over the course of five days. An average of about 13 logins per day.
Here’s how those numbers break down by town and gender served.
Week 4: The Hub had 38 individual youth generate a total of 67 logins over the course of 4 days. An average of about 17 logins per day.
Here’s how those numbers break down by town and gender served.
Week 5: The Hub had 29 individual youth generate a total of 51 logins over the course of 4 days. An average of about 13 logins per day.
Here’s how those numbers break down by town and gender served.